
Earlier this year we added a feature that unlocked important information trapped inside charts and diagrams, abundant in business reports and slide decks.
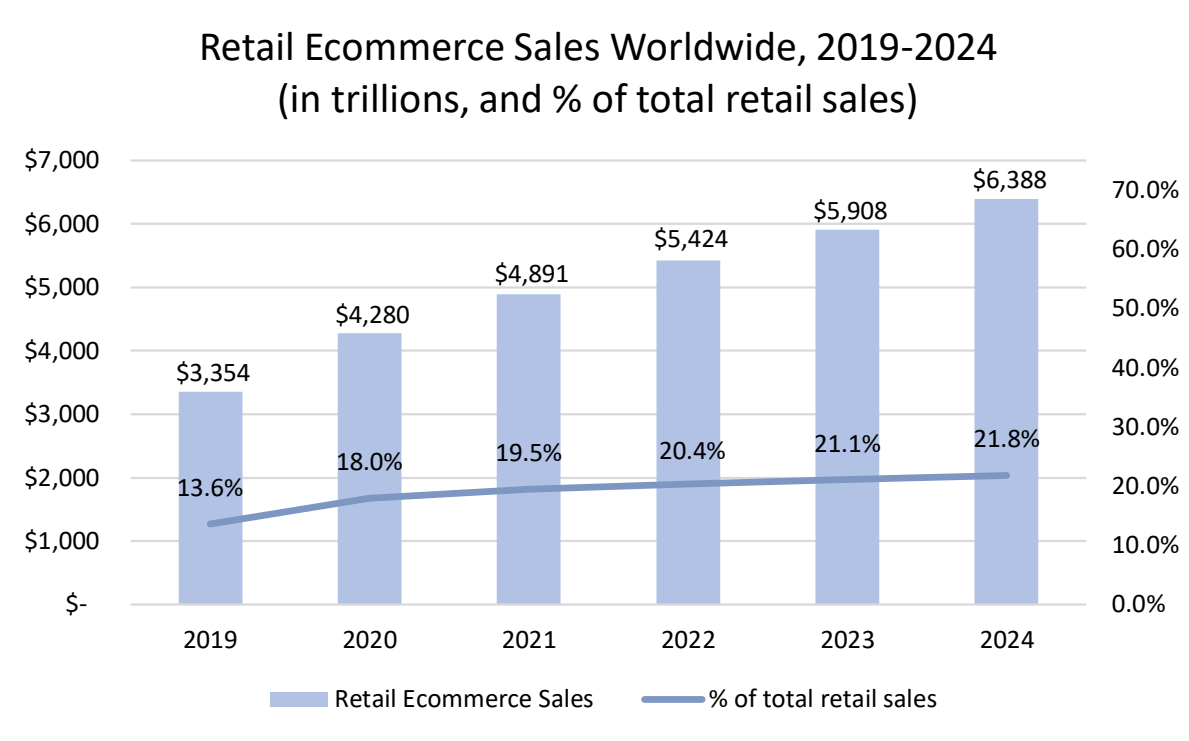
Source: Chart page from public ParseBench dataset. Parsed with Datalab's Convert on balanced mode.
| Year | Retail Ecommerce Sales (in trillions) | % of total retail sales |
|---|---|---|
| 2019 | $3,354 | 13.6% |
| 2020 | $4,280 | 18.0% |
| 2021 | $4,891 | 19.5% |
| 2022 | $5,424 | 20.4% |
| 2023 | $5,908 | 21.1% |
| 2024 | $6,388 | 21.8% |
Today we’re shipping a rebuilt version.
Better, and faster
We compared the new version with the previous on an internal evaluation set with thousands of pages. The new version improved on:
- Accuracy: outputs score 28% higher on accuracy and 18% higher on completeness than the previous version.
- Faithfulness: 56% fewer generated figures contain values unsupported by the source chart, and 93% fewer generated outputs contain incorrect values.
- Text preservation: now page text outside a chart never changes. The previous version altered surrounding text on roughly 4% of pages.
It’s also faster. We timed both versions on pages with at least one data chart, running Convert in balanced mode:
| Per page with a chart | Before | Now | ||
|---|---|---|---|---|
| p50 | p90 | p50 | p90 | |
| Chart understanding step | 34.3 s | 47.2 s | 9.1 s | 15.3 s |
Full Convert (balanced + chart understanding) | 47.2 s | 71.2 s | 22.6 s | 45.0 s |
Lower is better. p50 is the median time it takes to process a page; p90 is the 90th-percentile time.
Examples
U.S. Treasury; Monthly Treasury Statement
Every month the U.S. Treasury publishes an official federal report that provides a precise accounting of tax revenues, expenditures, and national budget. Two pie charts and a stacked bar chart on a monthly are represented as HTML or markdown data tables.
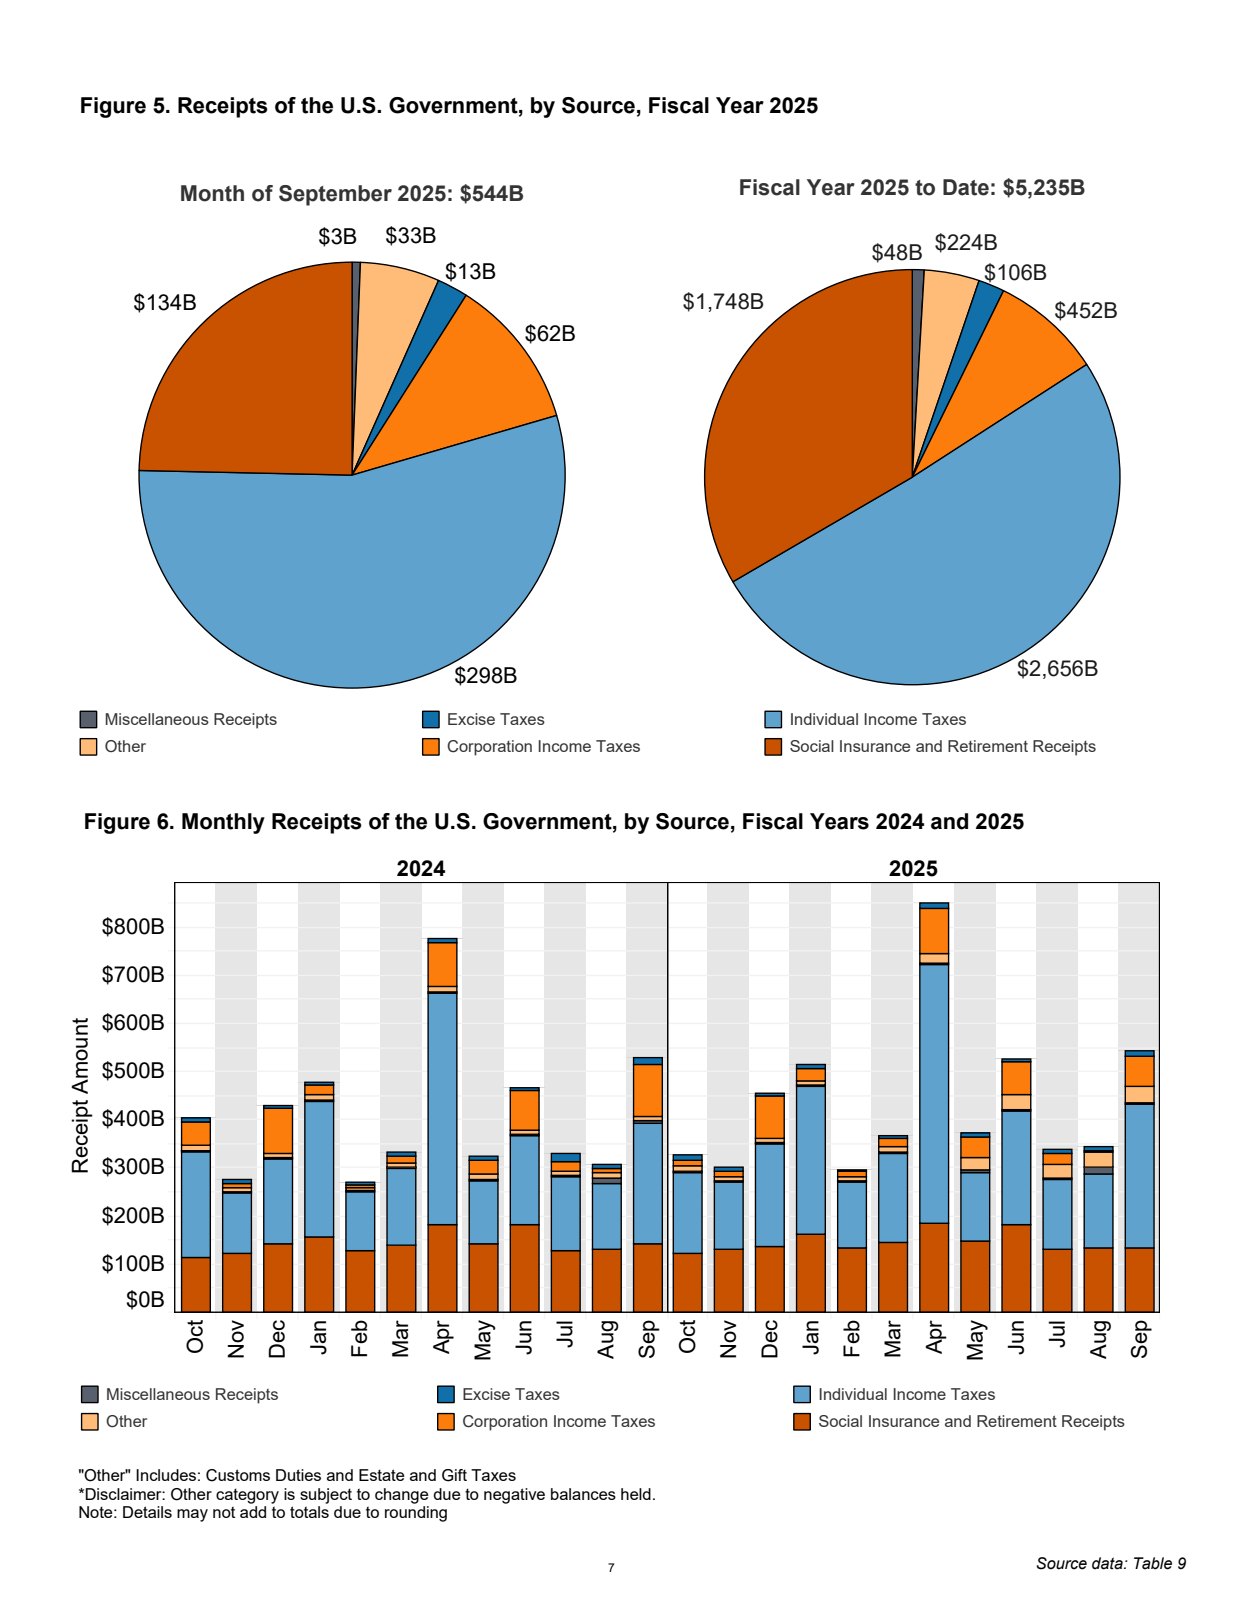
Figure 5. Receipts of the U.S. Government, by Source, Fiscal Year 2025
Month of September 2025: $544B
| Source | Amount ($B) |
|---|---|
| Social Insurance and Retirement Receipts | 134 |
| Individual Income Taxes | 298 |
| Corporation Income Taxes | 62 |
| Excise Taxes | 13 |
| Other | 33 |
| Miscellaneous Receipts | 3 |
Fiscal Year 2025 to Date: $5,235B
| Source | Amount ($B) |
|---|---|
| Social Insurance and Retirement Receipts | 1,748 |
| Individual Income Taxes | 2,656 |
| Corporation Income Taxes | 452 |
| Excise Taxes | 106 |
| Other | 224 |
| Miscellaneous Receipts | 48 |
Figure 6. Monthly Receipts of the U.S. Government, by Source, Fiscal Years 2024 and 2025
| Fiscal Year | Month | Social Insurance and Retirement Receipts ($B) | Individual Income Taxes ($B) | Excise Taxes ($B) | Corporation Income Taxes ($B) | Other ($B) | Miscellaneous Receipts ($B) | Total ($B) |
|---|---|---|---|---|---|---|---|---|
| 2024 | Oct | 115 | 218 | 6 | 56 | 7 | 2 | 404 |
| 2024 | Nov | 123 | 125 | 8 | 7 | 9 | 3 | 275 |
| 2024 | Dec | 141 | 178 | 10 | 93 | 5 | 2 | 429 |
| 2024 | Jan | 154 | 282 | 8 | 25 | 8 | 4 | 481 |
| 2024 | Feb | 128 | 121 | 6 | 6 | 7 | 3 | 271 |
| 2024 | Mar | 138 | 159 | 8 | 17 | 9 | 3 | 334 |
| 2024 | Apr | 182 | 483 | 11 | 89 | 9 | 3 | 777 |
| 2024 | May | 141 | 131 | 9 | 31 | 9 | 3 | 324 |
| 2024 | Jun | 182 | 181 | 12 | 82 | 7 | 3 | 467 |
| 2024 | Jul | 127 | 155 | 9 | 27 | 9 | 3 | 330 |
| 2024 | Aug | 129 | 137 | 10 | 19 | 8 | 3 | 306 |
| 2024 | Sep | 140 | 253 | 11 | 107 | 15 | 3 | 529 |
| 2025 | Oct | 122 | 166 | 9 | 18 | 8 | 4 | 327 |
| 2025 | Nov | 130 | 139 | 7 | 11 | 9 | 4 | 300 |
| 2025 | Dec | 136 | 212 | 11 | 87 | 6 | 2 | 454 |
| 2025 | Jan | 160 | 310 | 8 | 21 | 10 | 4 | 513 |
| 2025 | Feb | 134 | 135 | 7 | 8 | 7 | 3 | 294 |
| 2025 | Mar | 144 | 186 | 9 | 16 | 7 | 3 | 365 |
| 2025 | Apr | 185 | 534 | 11 | 101 | 18 | 4 | 853 |
| 2025 | May | 147 | 142 | 9 | 60 | 9 | 4 | 371 |
| 2025 | Jun | 183 | 235 | 12 | 84 | 9 | 3 | 526 |
| 2025 | Jul | 130 | 144 | 9 | 41 | 10 | 4 | 338 |
| 2025 | Aug | 133 | 153 | 10 | 37 | 9 | 3 | 345 |
| 2025 | Sep | 134 | 298 | 13 | 62 | 33 | 3 | 544 |
"Other" Includes: Customs Duties and Estate and Gift Taxes
*Disclaimer: Other category is subject to change due to negative balances held.
Note: Details may not add to totals due to rounding
7
Source data: Table 9
Source: U.S. Treasury, Monthly Treasury Statement, September 2025, p. 7 · output: Convert (balanced) with chart understanding
United Nations; E-Government Survey
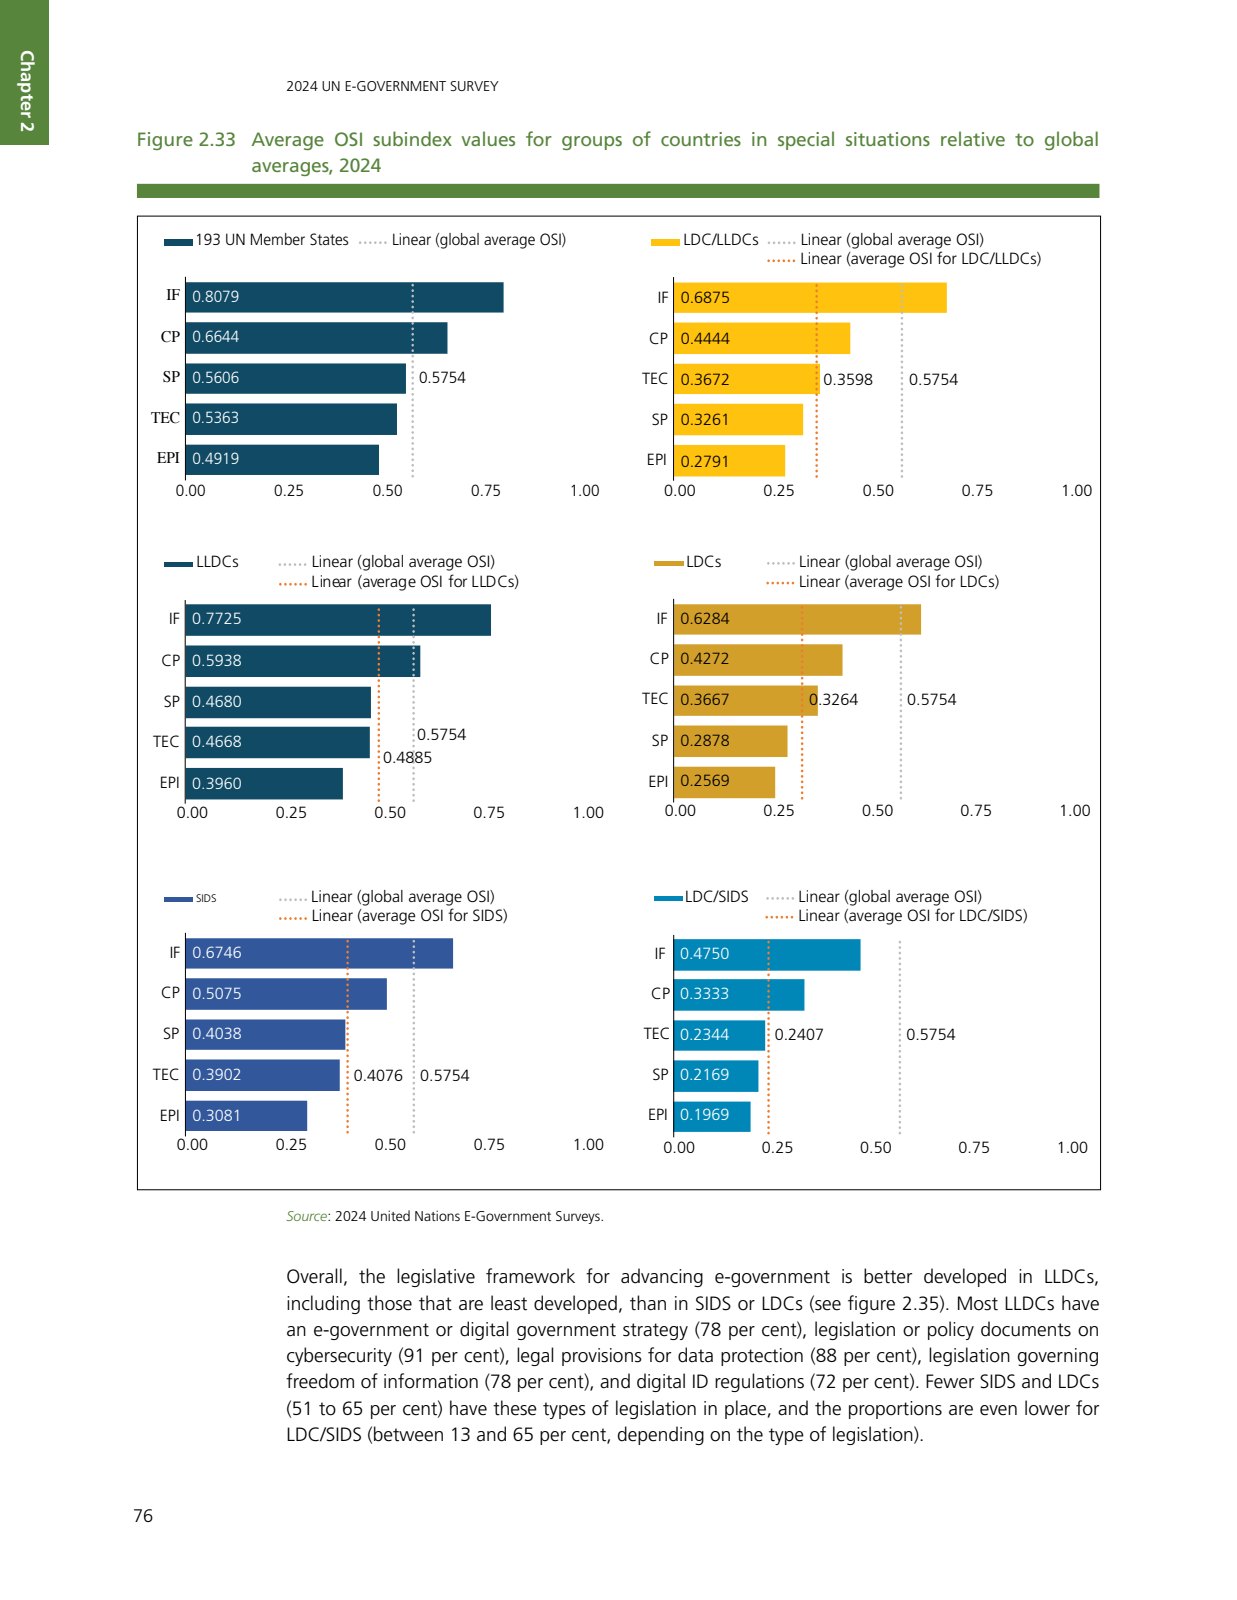
The UN publishes global report card on how well governments use digital technology to serve people. The six horizontal bar charts and the marks on the graph are represented as a markdown or HTML data table.
Chapter 2
2024 UN E-GOVERNMENT SURVEY
Figure 2.33 Average OSI subindex values for groups of countries in special situations relative to global averages, 2024
| Group | Subindex | Value | Linear (global average OSI) | Linear (average OSI for Group) |
|---|---|---|---|---|
| 193 UN Member States | IF | 0.8079 | 0.5754 | 0.5754 |
| CP | 0.6644 | 0.5754 | 0.5754 | |
| SP | 0.5606 | 0.5754 | 0.5754 | |
| TEC | 0.5363 | 0.5754 | 0.5754 | |
| EPI | 0.4919 | 0.5754 | 0.5754 | |
| LDC/LLDCs | IF | 0.6875 | 0.5754 | 0.3598 |
| CP | 0.4444 | 0.5754 | 0.3598 | |
| TEC | 0.3672 | 0.5754 | 0.3598 | |
| SP | 0.3261 | 0.5754 | 0.3598 | |
| EPI | 0.2791 | 0.5754 | 0.3598 | |
| LLDCs | IF | 0.7725 | 0.5754 | 0.4885 |
| CP | 0.5938 | 0.5754 | 0.4885 | |
| SP | 0.4680 | 0.5754 | 0.4885 | |
| TEC | 0.4668 | 0.5754 | 0.4885 | |
| EPI | 0.3960 | 0.5754 | 0.4885 | |
| LDCs | IF | 0.6284 | 0.5754 | 0.3264 |
| CP | 0.4272 | 0.5754 | 0.3264 | |
| TEC | 0.3667 | 0.5754 | 0.3264 | |
| SP | 0.2878 | 0.5754 | 0.3264 | |
| EPI | 0.2569 | 0.5754 | 0.3264 | |
| SIDS | IF | 0.6746 | 0.5754 | 0.4076 |
| CP | 0.5075 | 0.5754 | 0.4076 | |
| SP | 0.4038 | 0.5754 | 0.4076 | |
| TEC | 0.3902 | 0.5754 | 0.4076 | |
| EPI | 0.3081 | 0.5754 | 0.4076 | |
| LDC/SIDS | IF | 0.4750 | 0.5754 | 0.2407 |
| CP | 0.3333 | 0.5754 | 0.2407 | |
| TEC | 0.2344 | 0.5754 | 0.2407 | |
| SP | 0.2169 | 0.5754 | 0.2407 | |
| EPI | 0.1969 | 0.5754 | 0.2407 |
Source: 2024 United Nations E-Government Surveys.
Overall, the legislative framework for advancing e-government is better developed in LLDCs, including those that are least developed, than in SIDS or LDCs (see figure 2.35). Most LLDCs have an e-government or digital government strategy (78 per cent), legislation or policy documents on cybersecurity (91 per cent), legal provisions for data protection (88 per cent), legislation governing freedom of information (78 per cent), and digital ID regulations (72 per cent). Fewer SIDS and LDCs (51 to 65 per cent) have these types of legislation in place, and the proportions are even lower for LDC/SIDS (between 13 and 65 per cent, depending on the type of legislation).
76
Source: United Nations, E-Government Survey 2024, p. 76 · output: Convert (balanced) with chart understanding
International Energy Agency; Renewables Report
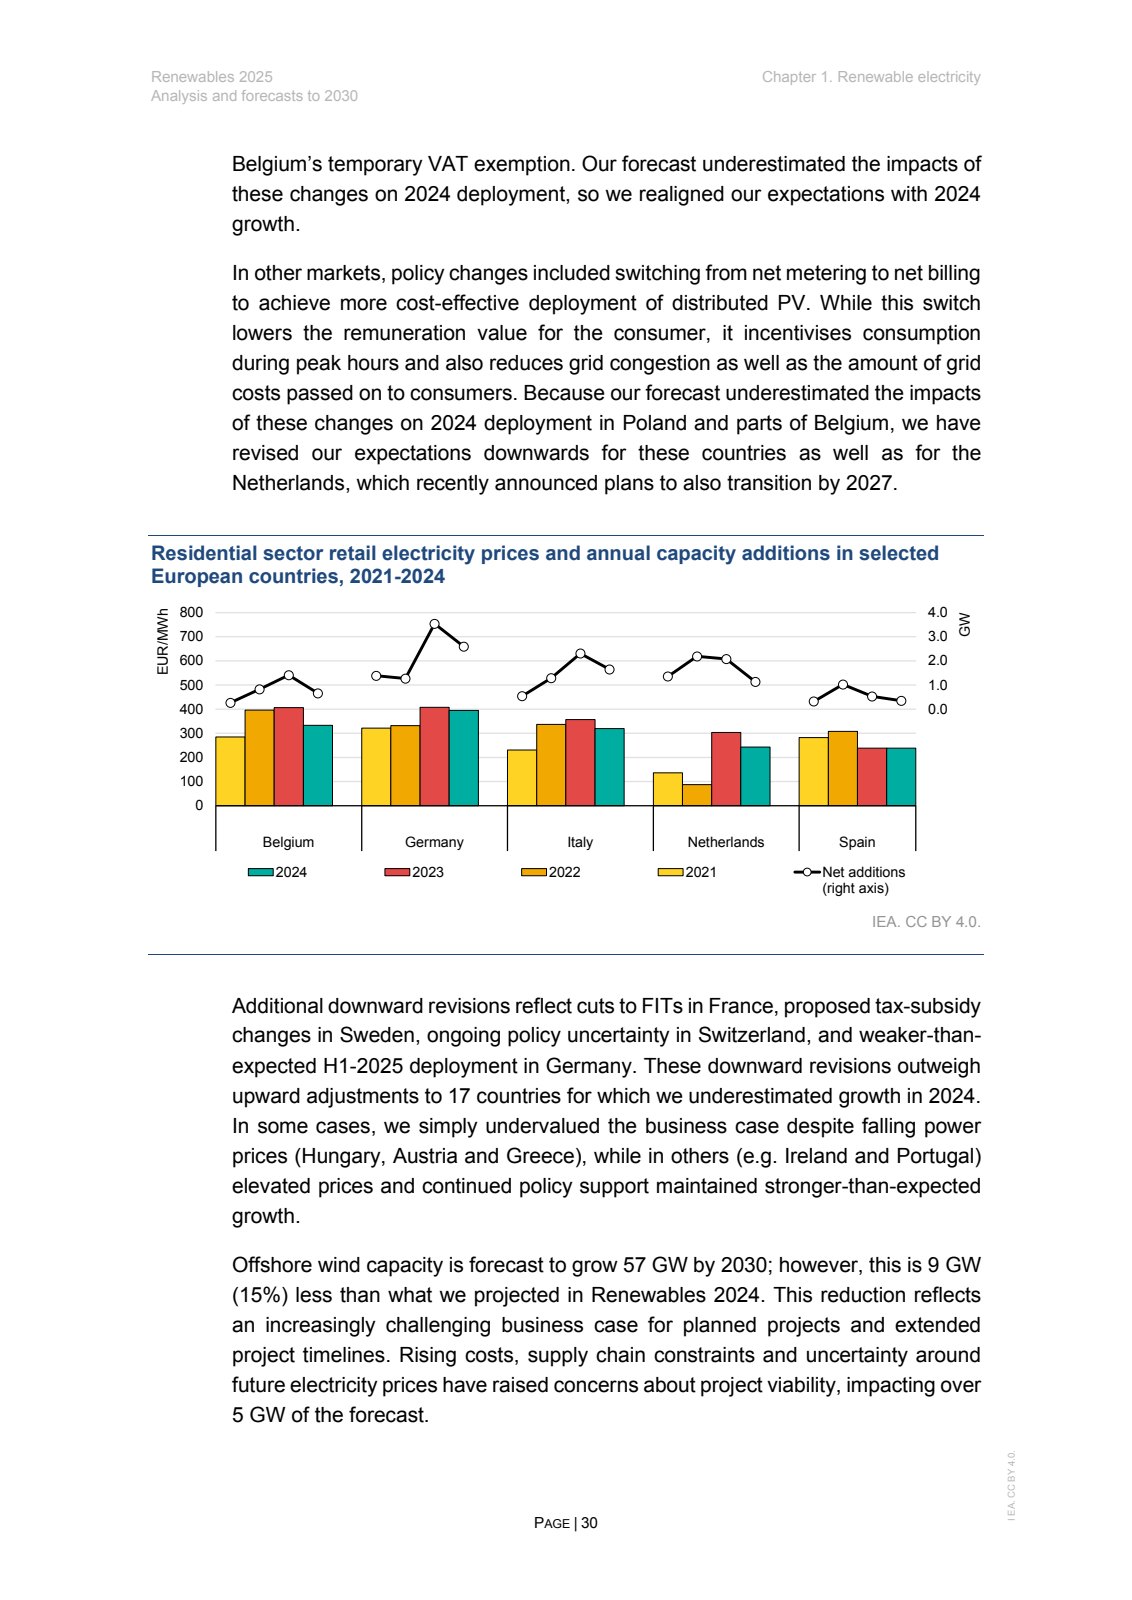
The IEA publishes Renewables annually as a major assessment of the global renewable-energy market. Combo charts with two axes are represented as a markdown or HTML data table with a text description.
Renewables 2025
Analysis and forecasts to 2030
Chapter 1. Renewable electricity
Belgium’s temporary VAT exemption. Our forecast underestimated the impacts of these changes on 2024 deployment, so we realigned our expectations with 2024 growth.
In other markets, policy changes included switching from net metering to net billing to achieve more cost-effective deployment of distributed PV. While this switch lowers the remuneration value for the consumer, it incentivises consumption during peak hours and also reduces grid congestion as well as the amount of grid costs passed on to consumers. Because our forecast underestimated the impacts of these changes on 2024 deployment in Poland and parts of Belgium, we have revised our expectations downwards for these countries as well as for the Netherlands, which recently announced plans to also transition by 2027.
Residential sector retail electricity prices and annual capacity additions in selected European countries, 2021-2024
| Country | EUR/MWh | Net additions (right axis) [GW] | ||||||
|---|---|---|---|---|---|---|---|---|
| 2021 | 2022 | 2023 | 2024 | 2021 | 2022 | 2023 | 2024 | |
| Belgium | 285 | 395 | 405 | 335 | 0.3 | 0.8 | 1.4 | 0.7 |
| Germany | 320 | 330 | 410 | 395 | 1.4 | 1.3 | 3.5 | 2.6 |
| Italy | 230 | 335 | 355 | 320 | 0.5 | 1.3 | 2.3 | 1.6 |
| Netherlands | 135 | 90 | 305 | 245 | 1.4 | 2.2 | 2.1 | 1.1 |
| Spain | 280 | 310 | 240 | 240 | 0.3 | 1.0 | 0.5 | 0.3 |
IEA. CC BY 4.0.
Additional downward revisions reflect cuts to FITs in France, proposed tax-subsidy changes in Sweden, ongoing policy uncertainty in Switzerland, and weaker-than-expected H1-2025 deployment in Germany. These downward revisions outweigh upward adjustments to 17 countries for which we underestimated growth in 2024. In some cases, we simply undervalued the business case despite falling power prices (Hungary, Austria and Greece), while in others (e.g. Ireland and Portugal) elevated prices and continued policy support maintained stronger-than-expected growth.
Offshore wind capacity is forecast to grow 57 GW by 2030; however, this is 9 GW (15%) less than what we projected in Renewables 2024. This reduction reflects an increasingly challenging business case for planned projects and extended project timelines. Rising costs, supply chain constraints and uncertainty around future electricity prices have raised concerns about project viability, impacting over 5 GW of the forecast.
PAGE | 30
IEA. CC BY 4.0.
Source: IEA, Renewables 2025, p. 30 (CC BY 4.0) · output: Convert (balanced) with chart understanding
Japanese Ministry of Health, Labour and Welfare; Regulatory Guidance
This is an official regulatory decision flowchart. It outlines when software qualifies as a medical device under Japan’s Pharamaceuticals and Medical Devices Act. Flowchart 4 is represented as a mermaid diagram with an attached description that can be rendered in Markdown.
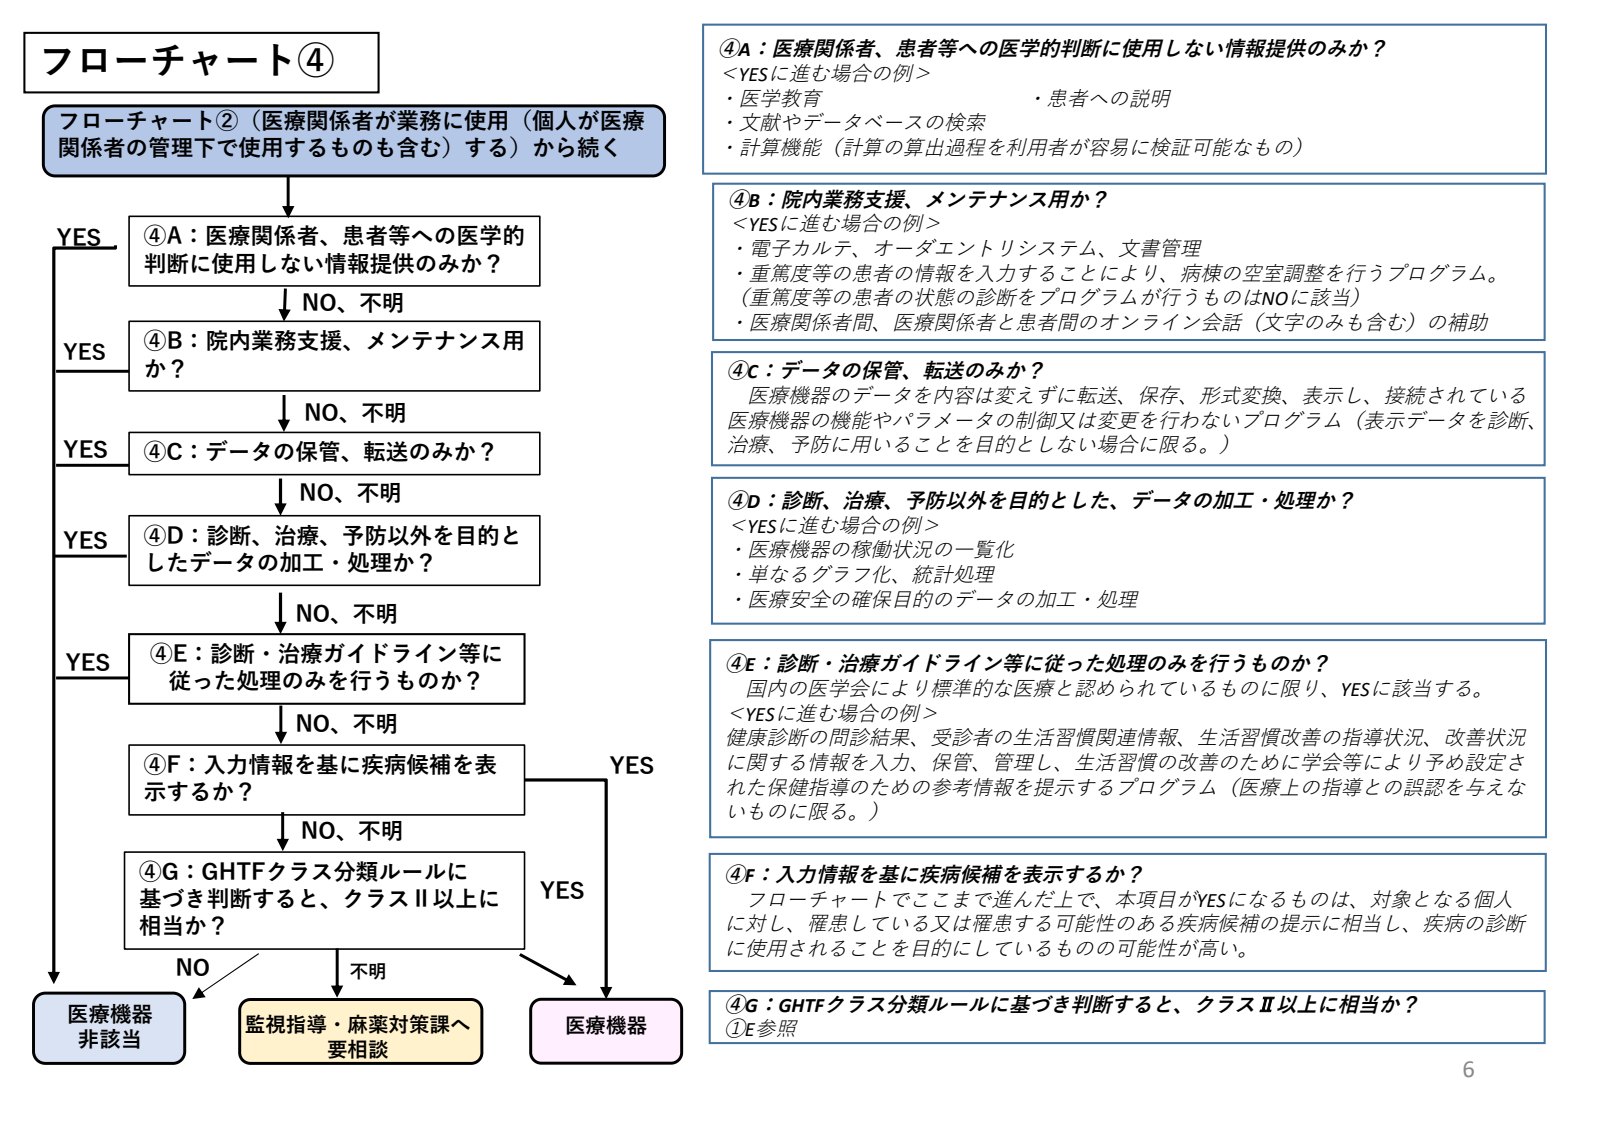
フローチャート②(医療関係者が業務に使用(個人が医療関係者の管理下で使用するものも含む)する)から続く

Flowchart 4: Decision process for medical device classification based on usage and data processing.
<YESに進む場合の例>
- ・医学教育
- ・患者への説明
- ・文献やデータベースの検索
- ・計算機能(計算の算出過程を利用者が容易に検証可能なもの)
<YESに進む場合の例>
- ・電子カルテ、オーダエントリシステム、文書管理
- ・重篤度等の患者の情報を入力することにより、病棟の空室調整を行うプログラム。(重篤度等の患者の状態の診断をプログラムが行うものはNOに該当)
- ・医療関係者間、医療関係者と患者間のオンライン会話(文字のみも含む)の補助
医療機器のデータを内容は変えずに転送、保存、形式変換、表示し、接続されている医療機器の機能やパラメータの制御又は変更を行わないプログラム(表示データを診断、治療、予防に用いることを目的としない場合に限る。)
<YESに進む場合の例>
- ・医療機器の稼働状況の一覧化
- ・単なるグラフ化、統計処理
- ・医療安全の確保目的のデータの加工・処理
国内の医学会により標準的な医療と認められているものに限り、YESに該当する。
<YESに進む場合の例>
健康診断の問診結果、受診者の生活習慣関連情報、生活習慣改善の指導状況、改善状況に関する情報を入力、保管、管理し、生活習慣の改善のために学会等により予め設定された保健指導のための参考情報を提示するプログラム(医療上の指導との誤認を与えないものに限る。)
フローチャートでここまで進んだ上で、本項目がYESになるものは、対象となる個人に対し、罹患している又は罹患する可能性のある疾病候補の提示に相当し、疾病の診断に使用されることを目的にしているものの可能性が高い。
①E参照
Source: 厚生労働省 (Japan MHLW), プログラムの医療機器該当性に関するガイドライン, フローチャート④ · output: Convert (balanced) with chart understanding
Try it out
Chart understanding is an add-on to Convert.
Enable it with extras=chart_understanding on the API.
The update is live now, and pricing stays the same as before: $3 per 1,000 pages on top of Convert. For on-premise deployments or help evaluating it on your own documents, reach out at [email protected].